Products
PRODUCTS Breadcrumb: Home > Products > Semiconductor Particle Detection
 Updated:2026-11-10
 Views:
Semiconductor particle detection runs on two separate measures, air and surface: particle counters cover the suspended state, scanners cover regular samples, and wipe sampling supplies standard units for formal statements. Machine surfaces, carrier inner walls, and maintenance areas have long depended on experience - 365 nm UV fluorescence locates organic residue and fibers, and high-intensity grazing light makes inorganic particles visible. This article sets out the boundaries of five methods, a decision table that routes by problem type, and the reading baseline and lamp selection points for a clean area.
On a semiconductor line, particle detection is never the work of one instrument. Particles suspended in air, settled on a wafer, adhering to a machine surface, and trapped in a carrier slot are four kinds of contamination with different physical states, different causes, and different remedies. Many teams collapse all of them into one question called cleanliness, and the result is a set of tools that covers one segment while the rest still relies on visual inspection and experience.
This article sets the five common methods side by side and explains, segment by segment, which part each covers, how far its data can be taken, and when it fails. After reading it you should be able to answer one specific question: for the investigation in front of you, which instrument goes first, and which goes second.
A grade under ISO 14644-1 counts suspended particles per unit volume of air, at several size thresholds from 0.1 μm upward. It has defined sampling locations, sample volumes, and statistical rules, and the result is a grade certificate you can state externally.
Surface cleanliness is a different matter. It asks how many particles adhere per unit area, how their sizes are distributed, and how firmly they are held. Two positions in the same Class 100 room - a tool top cover and a rail gap - can differ by two or three orders of magnitude in surface cleanliness, and the air data shows none of that difference.
The distinction drives method selection: air data cannot judge whether a surface passes, and surface testing is not used to support a certificate. The two data sets answer two questions; they do not substitute for each other, and no conversion is needed. Most day-to-day trouble on a line sits in the surface segment, where particles have already settled, already been moved, and already come close to the wafer.
| Method | What it measures | Output | Typical stage | Main limitation |
|---|---|---|---|---|
| Airborne particle counter | Suspended particles, counted by size class | Counts per m³, convertible to a grade | Online monitoring in clean areas, air-change validation, room release | Air only; cannot see particles after they settle |
| Surface particle scanner | Particle size and position on regular sample surfaces | Size distribution, defect map, coordinates | Incoming wafers, glass substrates, polished parts | Requires a sample that fits the stage and the scan area; cannot measure a tool |
| Wipe sampling plus laboratory analysis | Transferable particles and ionic residue at defined points | Particles/cm2, ion concentration | Periodic verification, cleanroom certification, cleaning process confirmation | Points are chosen by people, so coverage is sampling-based; slow turnaround |
| 365 nm UV fluorescence | Organic residue, fibers, oils, skin flakes, adhesive traces | Fluorescence image and location, not quantitative | After tool PM, carrier inner walls, defect tracing | Inorganic particles do not fluoresce and are missed |
| High-intensity surface inspection (grazing view) | Surface particles, micro-scratches, fingerprints, hazy residue | Visual judgment, photographable | Wafer boxes, mirror parts, coated parts, glass covers | Depends on illuminance and angle; needs an established baseline |
The five rows are ordered by the form of contamination they cover, not by accuracy. The first three produce numbers; the last two let you sweep a whole surface quickly. The real question is not which is more accurate but which segment nobody is covering.
A particle counter is standard equipment in a cleanroom: mature, able to run continuously, and traceable. For the question of whether the air is out of specification, there is little to put in its place.
Its boundary is hard, though: the inlet draws suspended particles. A 3 μm fiber is counted before it settles, and once it drops into a rail gap it disappears from the data completely - and the counter cannot help you find it there. The more common case is air data passing all day while point defects keep appearing on wafers.
The right move then is not to sample more often but to change method and look for adhered contamination. That is why the four methods that follow exist.
A scanner sweeps the sample surface in steps by optical scatter or microscopic imaging and outputs a size distribution and defect coordinates, far more precise than the eye. For incoming wafers, glass substrates, and lens blanks - regular, size-controlled, movable samples - it is a good fit.
Its limit comes from its structure: the sample has to go onto a stage, the scan area is fixed by the machine, and curved parts, odd shapes, and installed equipment are out of reach. To check a section of rail, a gripper contact face, or the chamber door seal of a tool in production, the scanner route does not exist.
One detail is often overlooked: scan results have blind areas. Edges, chamfers, and the region around openings are often limited by fixturing and the optical path, and those are exactly the places where particles collect.
A defined area is wiped with a defined pressure and path, the cloth goes to particle counting or ion analysis, and the result is reported in particles/cm2 or ng/cm2. When you have to state a surface cleanliness figure externally, or pass a customer or third-party audit, this is the route you must take.
Its weakness is coverage. One sample corresponds to one point, and a room is spot-checked at a number of points, so the conclusion is statistically representative but cannot guarantee that unsampled locations are also clean. Sampling is also destructive: the wipe moves particles, so the same location cannot be sampled twice.
That places wipe sampling in verification and formal statement, not in problem finding. Problem finding is more efficient with the two visual methods that follow - use them to narrow a suspicious area to a few spots, then confirm by wipe sampling. With the two working together, the number of sampling points drops considerably.
365 nm is long-wave UV, and most organic materials emit visible fluorescence under it. Oils, fingerprints, skin flakes, silicone oil, cutting fluid, flux, organic adhesives, and most synthetic fibers are on that list. Under UV the contamination glows and clean areas stay dark, contrast is amplified, and in a dark field fibers a few hundred micrometers across are visible.
Its core value on site is location: it turns "which part of this machine is the problem" from a guess into a fact you can point at, photograph, and re-check. The difficulty in this kind of investigation is never the acceptance criterion; it is finding that one position on tens of square meters of equipment surface.
The capability limits must be stated clearly, or the method is easily misused:
In equipment terms, this kind of inspection needs a UV source that can be carried into the clean area, does not shed particles from its body, and covers a large enough area. The MNT-365A cleanroom particle inspection flashlight is built to that brief: a smooth one-piece body with no knurling or deep grooves, wipeable and disinfectable, shedding no particles or fibers in use, so it can enter the clean area after the standard entry procedure; the LUYOR-365L pushes the illuminated area to about 200 mm at 38 cm with a center intensity of about 6500 uW/cm2, suited to full-surface sweeps.
The division between them is clear: the 365L covers area work - incoming acceptance, full-surface re-check after cleaning, batch inspection of transfer containers; the MNT-365A covers routine work - high-frequency inspection of cleanroom bench tops, fixtures, and carrier slots where the lamp travels with the operator.
Inorganic particles that UV cannot reveal are made visible by another physical mechanism: directional scatter. Light is gathered into a beam with one direction and passed at an angle close to the surface, particles scatter light into the eye, the background stays dark, and the particles become bright points on a dark field. A uniform diffused ceiling light, by contrast, lights the whole surface and flattens the brightness difference between particles and background.
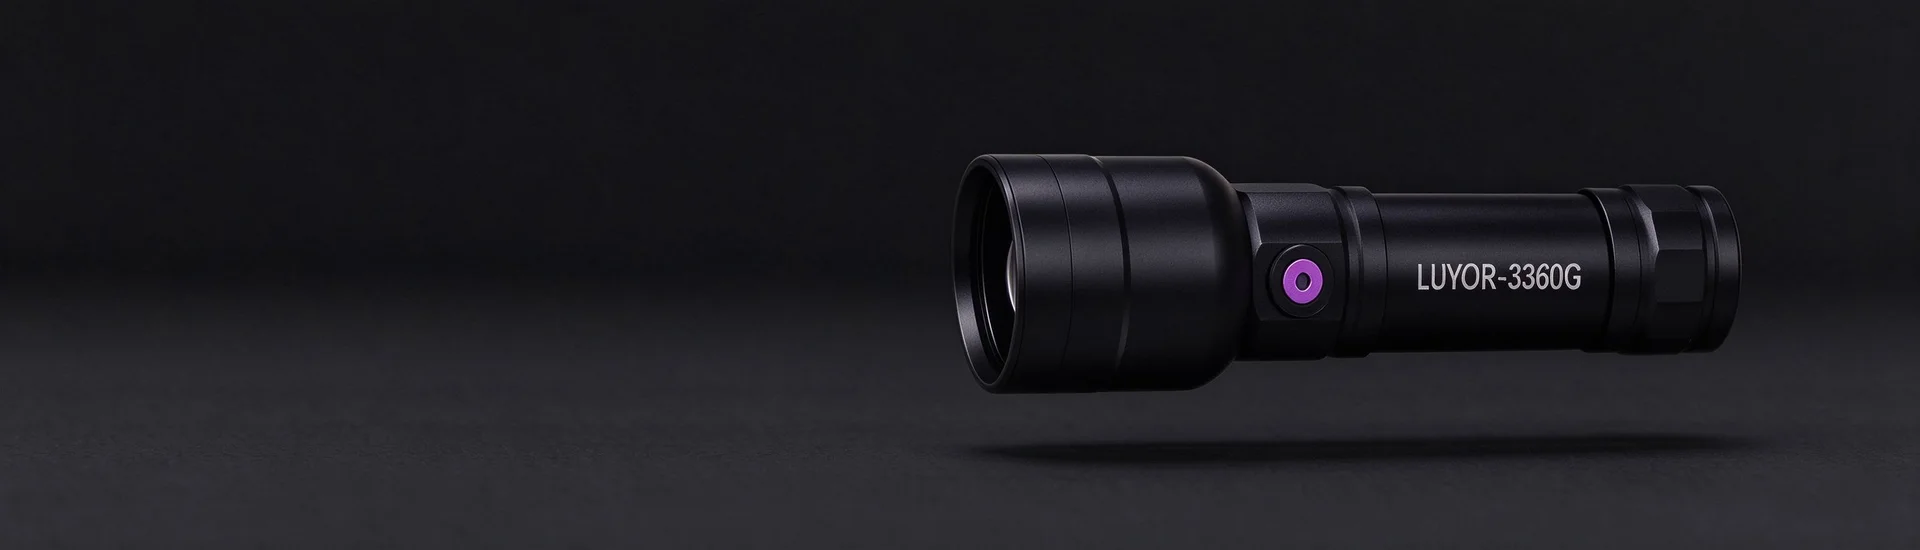
That is why "bright enough to see" and "able to see" are not the same thing. At equal power, the higher the collimation and the lower the stray light, the stronger the particle contrast. The LUYOR-3360G yellow-green surface inspection flashlight uses a 20 W laser source through a two-stage lens zoom to output a near-collimated beam, about 280,000 lux in a 5 cm spot at 40 cm, with 500-600 nm monochromatic output for a clean background, for particle and micro-scratch inspection on wafers, glass covers, lenses, and precision parts.
One detail belongs in the SOP: particles, fingerprints, and scratches each need a different angle. Particles take grazing light (body almost touching the surface, sweeping in a direction close to 180 degrees), fingerprints, water marks, and oil films take vertical light, and scratches are viewed vertically first and then re-checked at a 10°-30° offset. Concluding after a single-angle sweep is a frequent cause of missed defects.
The key to assembling the five methods into a workable process is to route by the form of the problem, not to rank equipment by accuracy.
| Site problem | First | Then | Closing confirmation |
|---|---|---|---|
| Is clean-area air in specification | Online particle counter data | - | Grade conclusion per ISO 14644-1 |
| Can incoming wafers or substrates be released | Surface particle scanner | Grazing light to re-check edges and chamfers | Wipe sampling for quantification (as needed) |
| Can the tool be handed over after PM | Areas swept with 365 nm UV | Grazing light for inorganic wear particles | Wipe sampling (critical stations) |
| Contamination on carrier inner walls and slots | UV sweep slot by slot | Grazing light for particles and scratches | Targeted cleaning, then re-sweep |
| Persistent point defects on wafers | UV quick pass over the whole process to narrow to a location | Grazing light to confirm particle form | Wipe sampling plus defect map comparison |
| Has the cleaning process removed the residue | UV before-and-after photographs | - | Wipe sampling for quantitative verification |
| Stating a surface cleanliness figure externally | Wipe sampling | - | Report in standard units |
There is a common rhythm in that table: visual methods narrow the range, quantitative methods confirm the conclusion. Doing it the other way - sampling first and waiting for the laboratory - often costs a full round before you learn the point was wrong, and the price is time and one shutdown.
The reliability of a visual method depends on whether the reading standard is the same for everyone. One machine and one person can give different verdicts in the morning and the afternoon, let alone across shifts. Before formal use, fix three things:
With those three in place, UV inspection and grazing inspection qualify for the SOP, and can be accepted as a link in the evidence chain of a traceability report.
1. Are you looking for organic residue or inorganic particles? Organics, oils, fibers, fingerprints → UV fluorescence; silicon dust, metal dust, glass fragments → grazing light; both → you need both, UV first to set the range, grazing light then to confirm the form.
2. Will the inspection point be carried into the clean area? It will. An industrial flashlight with knurling and deep grooves is a defect in a clean area, not an advantage - texture traps dust and is hard to wipe clean, and coating can flake, which means you create a new contamination source yourself. This ranks above brightness.
3. Is the inspection a full-surface sweep or a fixed-point look? A full sweep needs a large illuminated area and an even spot (such as the 200 mm area of the 365L); a fixed point needs high single-point intensity and margin in working distance.
4. Will it be used in a yellow-lit area? Photoresist is sensitive to blue-violet and UV, so lamps used in a yellow area should have yellow output, such as the 530-670 nm of the 3360Y; neither UV lamps nor white high-intensity flashlights suit continuous work in a yellow area.
The answers usually add up to one main lamp plus one support lamp, rather than a cabinet full of equipment with higher specifications.
A counter only draws suspended particles. Once a fiber or particle settles into a rail gap, a gripper contact face, or a chamber door seal, it leaves the air data. Sampling more often does not help; switch to methods that find adhered contamination: sweep for organic residue and fibers with 365 nm UV, then check for inorganic particles with grazing light, narrow the suspect area to a few spots, and use wipe sampling where quantitative confirmation is needed.
No. 365 nm excites visible fluorescence in most organic materials - oils, fingerprints, skin flakes, silicone oil, cutting fluid, flux, organic adhesives, and most synthetic fibers light up; silicon dust, metal wear particles, glass fragments, and quartz sand do not fluoresce at all and look the same with or without the lamp. Inorganic particles are a significant share of a semiconductor site, and they need grazing light or a surface particle scanner. Fluorescence also only locates; it cannot be converted into a count or a size, and is not a quantitative cleanliness index.
By the nature of the contaminant: organic residue, fibers, and oils take 365 nm UV; inorganic particles and micro-scratches take directional light at an angle close to the surface, so the particles scatter into bright points on a dark background. Neither path produces standard units; their value is fast location, a photograph, and a re-check. The usual site practice is UV to set the range, grazing light to confirm the form, and wipe sampling to close with a quantitative statement.
It is not well suited to that. One sample corresponds to one point, the conclusion is a statistical representation, and it does not guarantee that unsampled locations are clean; the wipe also moves particles, so the same point cannot be sampled twice, and results are slow. Its role is verification and external statement. To find a source, narrow the area with visual methods first, then confirm quantitatively with sampling, and the number of points falls considerably.
The scanner needs the sample on a stage, the area is limited by the machine, and curved parts, odd shapes, and installed equipment are out of reach. Edges, chamfers, and the region around openings also form blind areas through fixturing and optical limits, and those are exactly where particles collect. Regular, movable samples - incoming wafers, glass substrates, lens blanks - are its home ground.
The body should be smooth and one-piece, wipeable and disinfectable, with no knurling or deep grooves, shedding no particles or fibers in use, and it should enter the clean area only after the entry procedure. That ranks above brightness - a textured industrial flashlight is itself a contamination source in a clean area. In a yellow area, confirm the output band as well: photoresist is sensitive to blue-violet and UV, so ordinary UV lamps and white high-intensity flashlights do not suit continuous work there.
The difficulty in semiconductor particle detection is not accuracy but coverage. Air has the counter, incoming material has the scanner, and formal statement has wipe sampling; those three are already well covered by the standards system. What has long depended on experience is the segment in between - machine surfaces, carrier inner walls, the site after maintenance - large in area, irregular in shape, and impossible to dismantle or put into an instrument.
UV fluorescence and grazing light are the two ways to cover it: one for organics, one for inorganic particles, both fast, repeatable, and able to leave evidence. They do not produce standard-unit data, but they answer "where to wipe and whether it is clean" in a few minutes - and those are the two questions a line needs answered immediately.
For selection: MNT-365A and LUYOR-365L cover organic contamination by point and by area, and LUYOR-3360G covers inspection for inorganic particles and micro-scratches. Together the three cover most inspection needs on tools and carriers. For a configuration recommendation by station, an official datasheet for internal approval, or a demonstration on site, please contact Xinysun Instruments (Shanghai) - stock in Shanghai, with selection advice and demonstration support.

Email: info@xinysun.com

Tel: 131-2093-6518

Address: 1525 Minqiang Road, Bldg 26, Songjiang, Shanghai

Copyright 2026 Xinysun Instrument (Shanghai) Co., Ltd. All rights reserved.
ICP:ICP-2026046447




 Industrial Test Instruments


