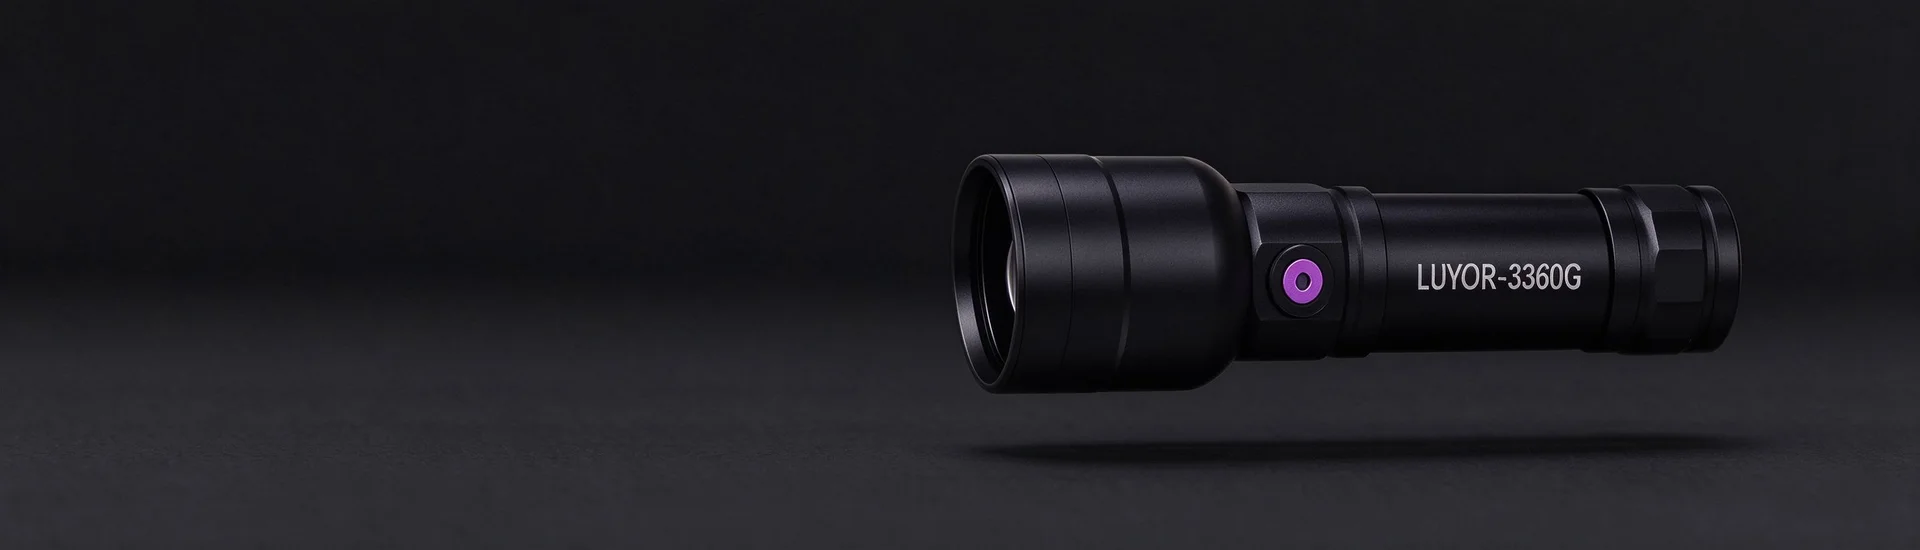
Applications
 Breadcrumb: Home > Applications > Lab Research
 Updated:2026-11-02
 Views:
Two strains are mixed 1:1 and co-cultured for six hours - which one comes out ahead? A CFU plate gives a total count but no ratio. A 2026 mLife paper on Acinetobacter baumannii put mCherry into the reference strain and read the plates on a LUYOR-3421 benchtop fluorescent protein excitation source, so that red and non-fluorescent colonies could be counted separately: a competitive index of 3.06 ± 0.88 at 3 hours and 3.45 ± 0.67 at 6 hours in BH broth. The article covers the experimental design, how the amplification strain was built, the competitive advantage seen across in vitro and mouse models, which module matches mCherry, and a six-step plating and reading procedure.
Two strains are mixed 1:1 and cultured together: which one comes out ahead after 6 hours? A CFU plate gives a total count but not a ratio. A 2026 paper in mLife on Acinetobacter baumannii put the red fluorescent protein mCherry into the reference strain and, after plating, read the colonies on a LUYOR-3421 benchtop fluorescent protein excitation source, so that red and non-fluorescent colonies could be counted separately. The methods section states it plainly: Colony ratios were determined using a LUYOR-3421 benchtop fluorescent protein excitation source and further confirmed by PCR with ISAba1-F/ISAba1-R primers. This article takes that step apart: how the label is set up, how the waveband is matched, how plates are read, and where the error comes from.
The logic of a competition assay is simple: mix the test strain and the reference strain in equal proportion, culture for a period, then see which way the ratio moves. A competitive index (CI) above 1 means the test strain is winning; below 1 means it is losing. The problem is that after mixing, the two strains grow identically on a plate, and the total CFU count cannot be split into two populations.
Three typing approaches are common, each with its own cost:
| Method | Approach | Limitation |
|---|---|---|
| Dual antibiotic markers | Each strain carries one resistance and is plated on its own selective medium | Clinical strains have complex resistance backgrounds, and two clean markers are often unavailable; two antibiotics also change growth rate |
| Colony-by-colony PCR | 20-24 single colonies picked at random per plate for colony PCR typing | Reliable, but laborious, and a low sampling fraction introduces statistical error |
| Fluorescent protein label | One strain expresses mCherry stably; the whole plate is counted by color | Needs an excitation source; reading relies on experience when expression is weak or colonies age |
The advantage of a fluorescent label is that no colonies have to be picked, no second culture is needed, and the whole plate is split by eye - a plate can be counted in tens of seconds. The cost is that reading introduces new variables: source intensity, illumination angle, ambient light and colony age all shift the boundary between "shows red" and "does not show red". What decides data quality is therefore not whether a lamp is purchased but whether reading conditions are fixed and reproducible.
The work was done at the State Key Laboratory of Microbial Diversity and Innovative Utilization, Institute of Microbiology, Chinese Academy of Sciences, on Acinetobacter baumannii. The authors began by analyzing 7490 genomes (582 completed and 6908 draft), and found that a segment carrying crp and osmC flanked by two ISAba1 elements amplifies in multiple copies; this composite transposon was registered as Tn7691. Among the 582 completed genomes, amplification at this locus appeared in 19 strains (3.3%), with copy numbers of 2-8, and every strain carrying Tn7691 or showing amplification belonged to ST2 or its single-locus variants.
To reproduce the amplification in the laboratory, the authors cloned the ISAba1-crp-osmC sequence into the pKFAb plasmid and electroporated it into ATCC 19606 to obtain a mimic amplification strain; qPCR confirmed a 6.23 ± 1.97 fold rise in crp copy number. An empty-vector control and an mCherry-labelled control were built alongside:
| Strain / plasmid | Fluorescent label | Role in the experiment |
|---|---|---|
| 19606 (pKFAb) | None | Empty-vector control for growth curve and transcriptome comparison |
| 19606 (pKFAb:crp-osmC) | None | Test strain mimicking crp-osmC amplification |
| 19606 (pKFAb:mCherry) | Red fluorescence | Reference strain for the competition assay, appearing red on plates |
| Clinical ST2 strain (pKF-ble / pKF-ble:crp-osmC) | None | Bleomycin resistance in place of kanamycin; typed by colony PCR |
Culture conditions were uniform: BHI broth, 37 °C, 200 rpm; plates were LB agar with kanamycin 50 mg/l (bleomycin 200 mg/l for the clinical strain work). The competition assay started at 5 × 10⁶ CFU/ml, mixed 1:1, co-cultured at 37 °C and sampled at 0, 3 and 6 hours, then serially diluted and plated.
The conclusion comes before the method, because the reading procedure described later exists to serve these numbers:
| System | Sampling time | Competitive index (CI) |
|---|---|---|
| In vitro BHI co-culture | 3 h | 3.06 ± 0.88 |
| In vitro BHI co-culture | 6 h | 3.45 ± 0.67 |
| Mouse lung colonization | 24 hpi | 3.56 ± 0.97 |
| Mouse intestinal colonization | 24 hpi | 2.12 ± 0.79 |
| Mouse serum co-incubation | 3 h | 3.09 ± 1.84 |
| Mouse serum co-incubation | 6 h | 9.00 ± 5.69 |
| Lung in the cyclophosphamide immunosuppression model | 24 hpi | 5.54 ± 1.98 |
On the growth curve, the amplification strain began to separate at about 12 hours and reached a higher stationary-phase OD600; amplifying crp alone or osmC alone did not produce this effect, so the phenotype requires both genes in multiple copies. In the serum killing assay, survival of the amplification strain at 3 and 6 hours was 3.49 ± 1.34 and 7.05 ± 2.75 times that of the reference strain. The transcriptome pointed to three pathways: phenylalanine metabolism, siderophore synthesis and sulfur metabolism; at the same time biofilm formation fell and susceptibility to β-lactams, polymyxin B, ciprofloxacin and chloramphenicol rose, which the authors interpret as a trade-off between host fitness and resistance.
The magnitude of these numbers deserves attention: a CI between 2 and 9 means the ratio between the two populations differs by roughly two to nine fold, not a lopsided difference. Miscounting a dozen colonies on either side is enough to shift the CI by more than 10%. Stability of reading decides whether the conclusion holds.
The original text gives this step one sentence, but its position matters: it comes after dilution plating and before PCR confirmation, and its job is to split the colonies on a whole plate into "red" and "non-fluorescent" groups and yield a ratio; the subsequent PCR with ISAba1-F/ISAba1-R primers confirms that the red colonies do carry the corresponding plasmid. The in vivo work follows the same logic - lung tissue and fecal homogenates are plated, counted the same way by red fluorescence and non-fluorescence, and the competitive index calculated.
In other words, the instrument here performs reading, not imaging quantification. It does not need to produce presentable fluorescence photographs; it needs to let the operator separate two colony groups reliably under fixed conditions. That also explains the choice of a benchtop model over a handheld lamp: plates are read one after another, at time points across 0, 3 and 6 hours, and position, angle and brightness have to be identical every time.
mCherry has an excitation peak at 587 nm and an emission peak at 610 nm, which places it among the red fluorescent proteins. The GR module of LUYOR-3421 excites at 510-540 nm green and is paired with a 590 nm long-pass filter, which lands on the short-wave shoulder of the mCherry excitation curve.
| Fluorescent protein / dye | Excitation peak | Emission peak | 3421 module | Emission filter |
|---|---|---|---|---|
| mCherry, DsRed, tdTomato | 587 nm | 610 nm | GR (510-540 nm) | 590 nm long-pass |
| GFP, eGFP, FITC | 488 nm | 507 nm | RB (440-460 nm) | 495 nm long-pass |
| YFP, Venus | 513 nm | 527 nm | CY (490-515 nm) | 550 nm long-pass |
| CFP | 433 nm | 475 nm | VI (400-415 nm) | 450 nm long-pass |
| DAPI, Hoechst | 358 nm | 461 nm | UV (360-380 nm) | 415 nm long-pass |
One technical detail needs stating: 510-540 nm is not the excitation peak of mCherry, and excitation there draws on the shoulder of the absorption curve, giving a weaker signal than 560-590 nm would. But mCherry is expressed strongly and packed densely inside a colony, so a yes/no classification is well within reach. For quantitative comparison of weakly expressing strains, or for measuring fluorescence intensity rather than counting, use longer-wavelength excitation or a fluorescence imaging system. That boundary should be kept clear, so a qualitative tool is not used as a quantitative instrument.
If an experiment carries both GFP and mCherry labels, fitting the RB and GR modules to one body is enough; they swap on BNC connectors in seconds, with no realignment of the light path.
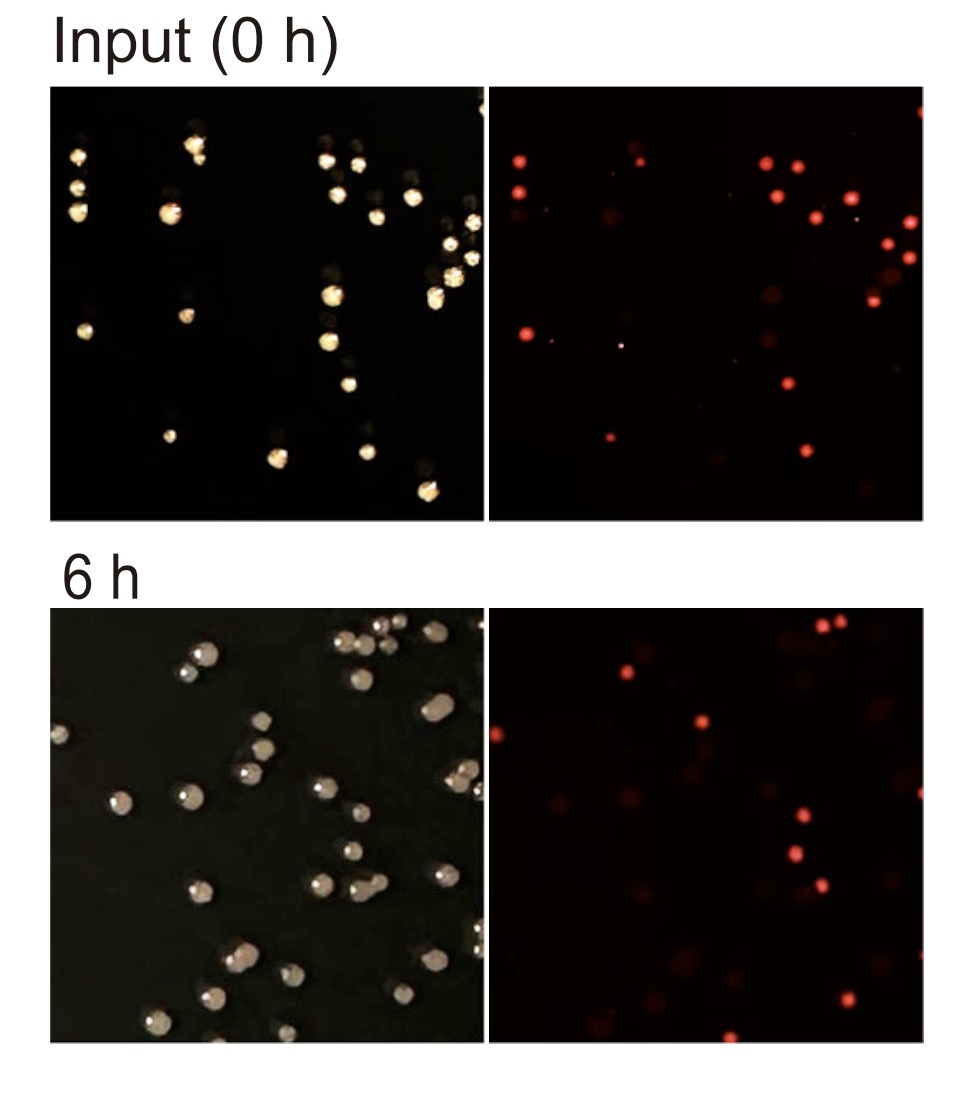
For the setting of this paper (90 mm plates, overnight culture, two colony groups mixed across the surface), the procedure can be organized into a reproducible sequence:
30-300 colonies per plate is a workable range. Too dense and colonies merge, so red and non-fluorescent cannot be counted separately; too sparse and the statistics become noisy. Make a 10-fold dilution series, plate two consecutive dilutions, and count the one that lands inside the range.
Count 18-24 hours after plating. Leave colonies longer and the red of mCherry dims as the colony ages, starting at the edges, which is how the same plate gets counted as 120 in the morning and 96 in the afternoon. If a re-check is needed, hold plates at 4 °C in the dark for no more than two days.
The plate of the empty-vector strain (no fluorescence) sets the negative threshold - a signal that is invisible on this plate counts as non-fluorescent; the plate of the mCherry single-label strain sets the positive intensity. Both controls must be read at the same brightness setting, or the threshold means nothing.
Bend the 500 mm gooseneck to 30-45° above the plate so the light spreads evenly over the whole dish. Direct frontal illumination produces a reflection band on the agar surface that hides part of the colonies; angled light also makes the fluorescence at colony edges stand out. Do not look into the lamp head while working.
A darkroom is not needed. Switch off direct bench lighting, close the blinds and keep away from window reflections. The output of a 20 W LED is enough to make red colonies clearly distinguishable under ordinary room lighting, and holding ambient light at a consistent level is more practical than making the room fully dark each time.
Draw a cross on the base of the dish to divide it into four sectors, count sector by sector and record. The 67 mm photography filter mounts directly on a DSLR, so the whole plate can be photographed - the image is not just an archive; if a result is disputed it can be re-read, which is far more reliable than recalling what was seen at the time.
| Reading parameter | Suggested setting | Reason |
|---|---|---|
| Colonies per plate | 30-300 | Avoids merging while keeping statistical power |
| Source angle | 30-45° oblique | Reduces specular reflection from the agar surface |
| Brightness setting | Same setting for the whole experiment | Keeps thresholds comparable |
| Ambient light | Direct lamps off, away from windows | Improves red/non-red contrast |
| Reading time | 18-24 h after plating | Colonies mature, fluorescence stable |
| Recording | Sector counts plus photographs | Results can be re-checked and traced |
CI is obtained by dividing one colony count by another, so an error in either numerator or denominator is amplified directly. In practice the problems that keep appearing cluster in six places:
| Symptom | Usual cause | Remedy |
|---|---|---|
| Red count too low | Colonies aged and fluorescence decayed; dark red read as negative | Count within 24 hours; fix the brightness setting; re-read weak signals from photographs |
| Red count too high | Agar or medium autofluorescence; negative threshold set too loosely | Use the same medium batch; run an empty-vector plate with each batch to set the threshold |
| Both counts too low | Plasmid loss; antibiotic degraded | Maintain selection with kanamycin 50 mg/l; prepare antibiotic fresh |
| Poor repeatability | Illumination angle and distance changed between sessions | Keep the benchtop unit in a fixed position; mark the gooseneck angle; do not move the body |
| Colonies merge and cannot be separated | Insufficient dilution or uneven spreading | Adjust the dilution series; spread until the plate surface is dry |
| Results disagree with PCR | False positives or false negatives in fluorescence reading | Pick colonies for colony PCR confirmation; the paper picked 20-24 per plate in the clinical strain group |
One more point is easily overlooked: false negatives in fluorescence reading systematically push the test strain ratio down. If a red colony is recorded as negative because expression is weak, the CI moves in the opposite direction to the truth, and that shift does not cancel out at random. Control plates, a fixed brightness setting and photographic records are therefore not formalities; they are preconditions for the data being credible.
LUYOR-3421 is positioned as a stereo microscope fluorescence adapter plus a standalone benchtop excitation source. In this kind of competition experiment the second form is what gets used: the body sits on the bench, the gooseneck brings the lamp head over the plate, and both hands are free for marking and counting.
| Item | Specification |
|---|---|
| Light source | 20 W high-power LED, large illuminated area, even spot |
| Wavelength modules | 6 groups: UV / VI / RB / RB-GO / CY / GR, BNC quick-change |
| Corresponding wavelengths | 365, 405, 450, 488, 505, 530 nm |
| Lamp arm | 500 mm flexible gooseneck, positionable at any angle |
| Dimming | Dimmer supplied as standard, continuously adjustable |
| Photography | 67 mm photography filter, mounts directly on a DSLR |
| Microscope fitting | Adapter ring clamps to the stand, no modification, fast on and off |
| Power | 110-220 V AC, 50/60 Hz |
Its second use comes in when detail matters: fit the adapter ring to a stereo microscope and insert the barrier filter below the objective, and expression distribution within a single colony can be examined under magnification, or the edge of a colony confirmed as genuinely red rather than confused by the agar background.
Other models in the series are positioned differently; select by scenario:
LUYOR-3415RG: dual-wavelength handheld, 0.9 kg, for screening while moving around an incubator room, a greenhouse or a field, one lamp per person.
LUYOR-3260RB: single-wavelength torch format, lighter and lower cost when the work involves GFP alone or RFP alone.
LUYOR-3124RB: large-area suspended format, for batch screening of seedling trays or large samples.
The criterion is really one question: does the sample come to the lamp, or does the lamp go to the sample? For plate counting, batch comparison and repeated reading across time points, use the benchtop unit; for work that moves between rooms and equipment, use the handheld.
Not necessarily. 587 nm is its excitation peak and gives the strongest signal, but colony reading needs just a yes/no decision, and 510-540 nm green is enough to excite a distinguishable red signal. What matters is using the same waveband and the same intensity each time, not chasing the peak.
No. Switching off direct lamps and staying away from window reflections is enough. What needs controlling is the stability of ambient light - a darkroom one day and a bright bench the next gives two different reading thresholds.
Rule out three things before anything else: whether the colonies are too old (red decays past 24 hours), whether the plate sat at 4 °C too long, and whether the plasmid was lost. If it is still dim after all three are excluded, expression itself may be low. In that case do not force a negative call; pick the colonies and run PCR instead.
Yes. This paper does exactly that: 3421 gives the colony ratio, and PCR with ISAba1-F/ISAba1-R confirms the identity of the red colonies; in the clinical strain group, 20-24 single colonies per plate were typed individually by PCR. Fluorescence reading provides efficiency, PCR provides identity.
30-300 is the usual range. Below 30 the statistics are noisy; above 300 colonies begin to merge and red signals overlap. In a mixed competition experiment the two colony groups are distributed at random, and the more evenly density is controlled, the better the repeatability of the CI.
By working style. If the reading bench is fixed, samples arrive in batches and photographs are needed for the record, choose 3421; if the work moves between incubator, greenhouse and field and one person carries the lamp while looking, choose 3415RG. Waveband coverage is the same; the difference is in form factor and illuminated area.
LUYOR-3421 benchtop fluorescent protein excitation source: six wavelength modules, 20 W LED, 500 mm gooseneck, doubling as a stereo microscope fluorescence adapter.
Positive screening of soybean hairy roots: LUYOR-3415RG in GmSIN1 salt tolerance research: a comparable workflow for reading plant material.
Tissue-culture-free hairy root transformation in raspberry: fast screening of eGFP-positive roots: the full chain from fluorescence pre-screening to PCR confirmation.
Choosing between a UV crosslinker and a fluorescent protein excitation source: how the two kinds of UV fluorescence tool divide the work, and common misuse.
What cosmetic phototoxicity means: the cell phototoxicity workflow and the 3T3 NRU assay: another application line built on light-cell interaction.
The methodological value of this paper is not which lamp was used but that it writes down clearly a step that is easily left vague: competition assay typing rests on a fluorescent label, and reading that label rests on fixed conditions. 1:1 mixing, sampling at 3 and 6 hours, PCR confirmation of 20-24 colonies per plate - those details together are what make CI = 3.06 credible.
For laboratories running similar experiments, three lessons can be copied: the labelled strain needs stable expression, the reading bench needs to stay put, and every batch needs negative and positive control plates. Instrument selection is one link in that chain, but it decides whether what you count is data or noise. If you are setting up a reading workflow for bacterial competition or colonization work, send us the labelling strategy, plate format and batch size and we can look at waveband and model configuration together; you can also leave a message through contact us.
This article sits in the laboratory research techniques section.
Other sections on the same product line are GFP fluorescence flashlights (models grouped by GFP/RFP/DsRed waveband, handheld and benchtop) and life science instruments (the entry point for fluorescence imaging, UV crosslinking, UV transmission and cell irradiation).
Models mentioned in this article: LUYOR-3421, LUYOR-3415RG, LUYOR-3260RB. Ranges, accuracy and accessory lists for each model are given on the product pages.

Email: info@xinysun.com

Tel: 131-2093-6518

Address: 1525 Minqiang Road, Bldg 26, Songjiang, Shanghai

Copyright 2026 Xinysun Instrument (Shanghai) Co., Ltd. All rights reserved.
ICP:ICP-2026046447




 Industrial Test Instruments


