Applications
 Breadcrumb: Home > Applications > Semiconductor Cleanroom
 Updated:2026-11-16
 Views:
In everyday cleanroom communication, two sentences get used as if they meant the same thing: "our cleanliness is Class 100" and "our surfaces are clean". The former is a grade printed on a certificate; the latter is a judgment made on the floor. Several layers of concept sit between them, and the cost of mixing them up is practical - the air data pass while particles still sit on the tool, the surface looks clean while wipe samples still exceed the limit.
This article separates the two systems: what ISO 14644-1 actually measures, where its boundary lies, which quantities are used to express surface cleanliness, why the two cannot be converted into each other, and how to give each data set its proper place on site.
The full title of ISO 14644-1 is "Cleanrooms and associated controlled environments - Part 1: Classification of air cleanliness by particle concentration". The title already states two things: it measures air, and it classifies by particle concentration.
The method is this: air is drawn at defined locations and defined sample volumes inside a controlled environment, a discrete particle counter tallies particles in each size channel, the counts are converted to particles per cubic meter, and a table turns that into a class (such as ISO 5 or ISO 7). Among the companion standards, 14644-2 covers the intervals for testing and monitoring, and 14644-3 covers the test methods.
Four technical features of this system have to be remembered:
With those four points in hand, the scope becomes clear: an ISO class describes the air filtration and airflow organization capability of the space. It is an engineering metric. It does not describe how clean the people and the tools inside that space are.
Surface cleanliness is about what has adhered to a unit of area. It has no internationally harmonized classification table of the kind ISO 14644-1 provides; in practice it is a stack of industry convention, customer specification and in-house standard. There are four main ways of expressing it:
| Expression | Example unit | Method | Typical use |
|---|---|---|---|
| Removable particle count | particles/cm2, by size channel | Wipe a defined area, then count particles | Surface cleanliness declaration, customer acceptance |
| Non-volatile residue | mg/cm2 or ng/cm2 | Solvent extraction, then gravimetry or analysis | Cleaning process validation, delivery of precision parts |
| Ionic contamination | ng/cm2 (by ion species) | Extraction followed by ion chromatography | Electronics assembly, pre-coating preparation |
| Visual / fluorescence criterion | No unit, graded judgment | Grazing high-intensity light, UV fluorescence visual check | Floor inspection, recheck after PM |
The relationship between these four rows is not "increasing precision" but "different questions answered". The top three produce numbers that can be declared externally; the fourth produces a basis for action that can be used immediately.
One key difference: surface sampling is destructive and local. A wipe transfers particles away from their original position, so the same spot cannot be sampled twice; and one sample represents no more than those few tens of square centimeters, which cannot be extrapolated to the whole room. That logic is completely unlike air sampling, where one point is taken to represent a volume of space.
People often ask: in a Class 100 room, how many particles per square centimeter are allowed on a surface? The question has no answer, because the physical relationship needed for the conversion does not exist. There are four reasons:
What is in the air is airborne; what is on a surface has adhered. A particle can go from airborne to adhered, but the rate of that transition depends on airflow, static charge, surface energy, humidity and the properties of the particle itself - and these variables differ enormously between locations in the same room. In one and the same room, the particle density on a tool's top cover (smooth airflow, little disturbance) and in a rail gap (oil film, friction) can differ by orders of magnitude.
An ISO class is a statement about the controlled space as a whole; points inside the space are allowed to differ as long as the sampling rules are met. Surface cleanliness is a point-by-point fact, and there is no such thing as a "room average" - a room can be very clean overall while one pocket is very dirty, and that pocket is exactly what determines yield.
Airborne particle concentration changes on a scale of seconds to minutes; a single person walking past can make a local concentration jump. Surface contamination accumulates, and particles left on a surface by one contamination event may stay there for days until cleaning removes them. The two data sets have different time resolution and cannot be aligned.
ISO 14644-1 starts its channels at 0.1 μm, whereas the surface contamination that is critical to a process is often larger (fibers and wear debris from a few micrometers to a few tens of micrometers) or much smaller (nanometer-scale residue). The two ranges follow different distribution laws and cannot be counted on the same basis.
In one sentence: air data passing means the tool does not leak dust, not that its surfaces are clean. Treating the two as synonyms is where many cleanliness disputes begin.
Here is a comparison commonly seen on a production line, to illustrate the order of magnitude (for illustration; actual values vary widely with process and location, and are used here just to show the relationship):
| Item | Air side | Surface side |
|---|---|---|
| Observed object | Airborne particle concentration | Adhered particles and residue |
| Unit | particles/m3 | particles/cm2, mg/cm2 |
| Rate of change | Seconds; jumps when people walk past | Days; slow change as contamination accumulates |
| Spatial representativeness | A sample point can represent an area | Point-by-point fact, not extrapolable |
| Destructive sampling | No, continuous monitoring is possible | Yes, the same spot cannot be sampled twice |
| Typical failure mode | Filter failure, airflow short-circuit, pressure differential fault | Incomplete cleaning, structural dead spots, contamination brought in by people |
| Corrective action | Adjust airflow, change filters, adjust pressure differential | Clean, change the structure, change the SOP |
Look at the last two rows - the failure modes and the corrective actions hardly overlap at all. That is why a sound cleanliness management system has to run both lines in parallel: with air data alone, a surface problem is never found; with surface data alone, a failed filtration system is never detected either.
Here is a workable principle: air data answer "does the environment meet its class", surface data answer "is this particular item fit for use".
None of these has a substitute; they have to be done with a particle counter.
Among these, the methods that produce a number (wipe sampling, residue analysis) carry the external declaration; the methods that produce no number but cover a whole surface quickly (grazing light, UV fluorescence) carry on-site localization and closed-loop confirmation. The relationship between the two is "narrow the range" and then "confirm the conclusion" - in that order.
Answering a surface complaint with air data. A customer reports particles on the product, and the plant produces the cleanroom class certificate and the online monitoring curve to prove "we are Class 100". Technically the answer is void - the customer's particles may come from a carrier inner wall, from the transfer step, or from packaging material, none of which is related to the room class. The correct action is a surface investigation that finds the path the particles took.
The reverse mismatch also happens: using a few surface wipe results to argue against air system maintenance. These are different metrics to begin with, and using one to deny the other means nothing.
The surface side has no harmonized classification table, so it is all the more important to define the methods clearly and fix the criteria. The three commonly used methods divide the work as follows:
Take a light source, collimate it into one direction, and rake it across the surface at a near-tangent angle. Particles scatter light into the eye, the background stays dark, and contrast is amplified. This is an effective way to find inorganic particles such as silicon chips, metal wear debris, glass shards and abrasive residue - exactly the class of particle that UV fluorescence cannot reveal.
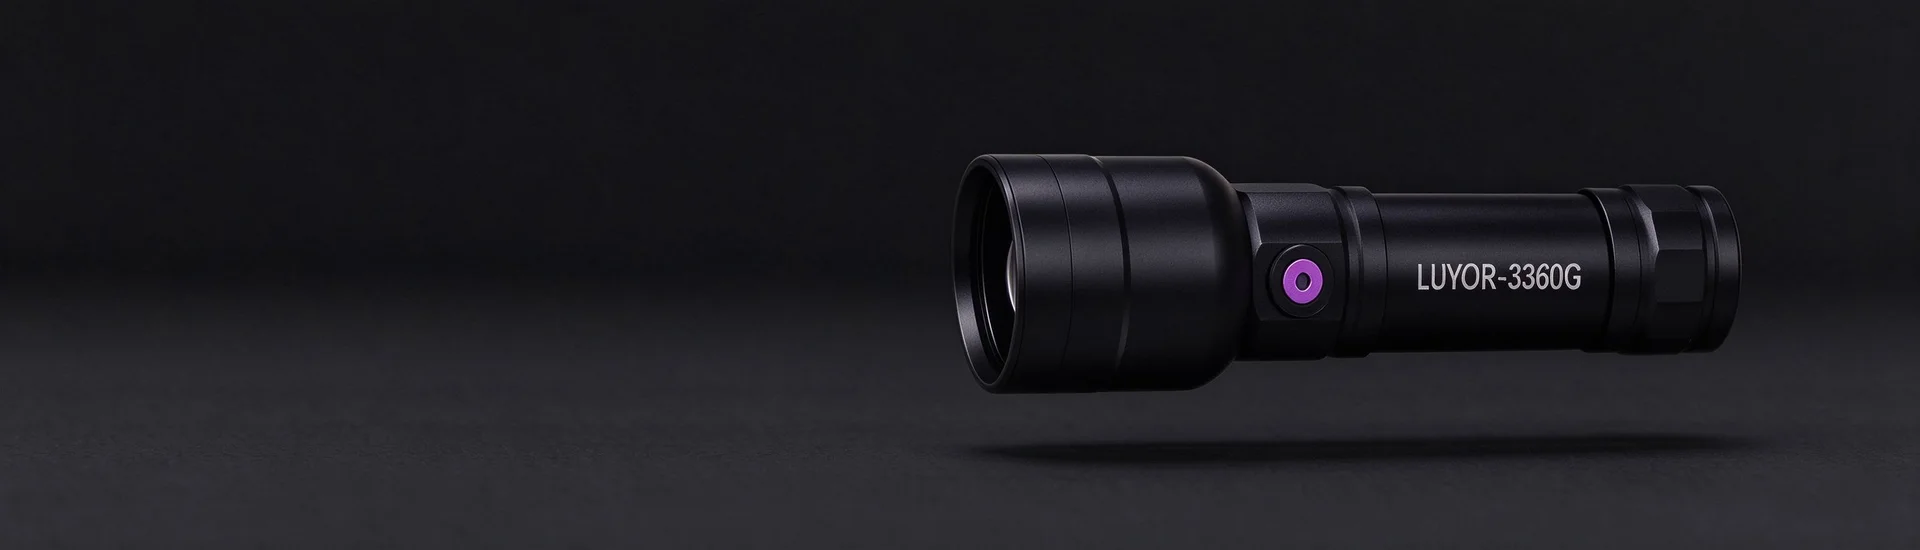
The key is the angle. Particles need grazing light, fingerprints and oil films need perpendicular illumination, and scratches need perpendicular illumination and then a 10°-30° offset for confirmation. Declaring a surface clean after one sweep at a single angle is a frequent cause of missed detection. The LUYOR-3360G uses a 20 W laser source with a secondary lens zoom to output a near-collimated beam: a 5 cm spot at 40 cm delivers about 280,000 lux, and the 500-600 nm monochromatic output keeps the background cleaner. With a 160 mm barrel and 340 g including battery, it suits long sweeping passes held close to the workpiece.
Grease, fingerprints, skin flakes, most fibers and organic adhesives emit visible fluorescence under 365 nm excitation. Its strength is localization and closed-loop verification - one pass shows where the surface is dirty, and a second pass after cleaning confirms the glow is gone. That comparison is direct evidence that cleaning worked.
The boundary has to be stated clearly: inorganic particles do not fluoresce and look no different from a clean surface under UV; and it is not quantitative - fluorescence intensity cannot be converted into a particle count and cannot serve as a cleanliness metric for external declaration.
Equipment taken into a clean zone has additional requirements. The MNT-365A uses a smooth one-piece housing with no knurling or deep grooves, can be wiped and disinfected, and does not shed particles or fibers in use; for large-area scanning there is the LUYOR-365L (about a 200 mm illuminated area at 38 cm). A knurled industrial flashlight is a defect rather than an advantage in a clean zone - the texture traps dust that is hard to wipe out, and repeated wiping can flake the coating, making the lamp a new particle source in itself.
When a number has to be issued externally, or a customer or third-party audit has to be satisfied, this route is necessary. Its role is verification and endorsement, not problem finding - the points are chosen by a person, and coverage is by sampling. A sound way to use it is to narrow the suspect area to a few spots with the earlier two methods, then do the quantitative confirmation at the critical points; that saves a good number of sample points and makes the conclusion more targeted.
Visual methods (grazing light, UV) produce no number, so they are easily challenged as "not objective". To make them hold up, three things have to be fixed:
With these three in place, visual criteria become reproducible, can be written into an SOP as an internal standard, and can be explained to an auditor.
There is no harmonized international answer; it depends on the product and the process. Three workable routes: adopt the surface cleanliness clauses in the customer specification; take industry convention values and set an internal control line together with your own historical data; or set it yourself by process sensitivity, where parts that touch wafers or optical surfaces directly should be held to a markedly stricter limit than housings and floors. What matters is that it is written down, reproducible and recorded, not that a "standard number" is reached.
Work backwards along the contamination path: every surface the product has touched. A suggested order is carrier inner walls and pockets, then transfer mechanisms and grippers, then the tool interior after PM, then packaging material, then gloves and garments. Go over each step with grazing light and UV, narrow the suspect range, and then quantify with wipe sampling. This path is far more effective than tightening air monitoring further.
Differences in test method. The number and position of sample points, the sample volume per point, the sampling height, the equipment state (at rest or operational) and the calibration status of the particle counter all affect the result. ISO 14644-1 specifies these parameters, but room for choice remains in execution. When comparing two reports, compare the methods before the conclusions.
That question points in the wrong direction. UV fluorescence responds to whether a material fluoresces, not to particle size. A fiber a few hundred micrometers long is obvious in a dark field, while a silicon chip of the same size is invisible. Visibility is decided by material and contrast, not by size. So there is no "lower detection limit in micrometers", which is also why it cannot be used for quantitative judgment.
By event, not by calendar. A recheck is required after PM work, after cleaning machine maintenance or a change of cleaning agent, after a change of personnel or fixtures, after a particle defect appears, and after an incoming material anomaly. A calendar interval means something solely when the state is stable and historical data are consistent.
The difficulty of cleanliness management rarely comes from standards that are not strict enough; it comes from concepts that are not clear - answering a surface question with air data, replacing a quantitative conclusion with a visual impression, letting one test stand for a long-term state.
Keep the two systems apart and the thinking becomes much clearer: ISO 14644-1 governs the environment and answers "does this tool leak dust"; surface cleanliness governs the item and answers "is this one fit for use". The former relies on a particle counter and a qualification interval; the latter relies on wipe sampling for numbers and on grazing light and UV fluorescence for localization and closed-loop confirmation. It takes both data sets to hold the room class and the product yield at the same time.
For a fuller breakdown of how five inspection methods divide the work and combine, see Semiconductor particle detection: the applicable boundary of five methods and how to combine them. To design a surface inspection plan for your cleanroom class and process stage, to request official datasheets for the LUYOR-3360G, MNT-365A and LUYOR-365L for internal approval, or to arrange an on-site demonstration, contact Xinyisheng Instruments (Shanghai) - stock in Shanghai, with selection advice and demonstration support.
This article belongs to the semiconductor cleanroom section.
Other sections on the same product line include 365 nm blacklight (UV area lamps for penetrant testing, leak detection and fluorescence inspection - look at irradiance, not wattage), surface inspection lamps (low-angle side light that pulls particles, scratches and fingerprints out of the background) and industrial test instruments (the entry point for UV inspection, tachometry, stroboscopy and surface inspection).
Models mentioned in this article: LUYOR-365L, LUYOR-3360G, MNT-365A. Ranges, accuracy and accessory lists for each model are given on the product pages.

Email: info@xinysun.com

Tel: 131-2093-6518

Address: 1525 Minqiang Road, Bldg 26, Songjiang, Shanghai

Copyright 2026 Xinysun Instrument (Shanghai) Co., Ltd. All rights reserved.
ICP:ICP-2026046447




 Industrial Test Instruments


